5K Pace Chart
A 25:00 5K is 5:00 per km or 8:03 per mile. Every 5K result from 12:00 to 60:00 with pace per km and per mile, km/h and mph, printable.
5K is 5 km (3.1069 miles). A 20:00 finish needs 4:00 per km (6:26 per mile, 15.0 kph), a 25:00 finish needs 5:00 per km (8:03 per mile, 12.0 kph) and a 30:00 finish needs 6:00 per km (9:39 per mile, 10.0 kph). The chart below lists every finish time from 12:00 to 1:00:00, one row every 30 seconds, with the elapsed time at 1 mile and 2 miles.
5K in 25:00
5:00 per km
- Pace per mile
- 8:03
- Speed (kph)
- 12.00
- Speed (mph)
- 7.46
- At 1 mile
- 8:03
- At 2 miles
- 16:06
Exact even pace for 25:00. Find in chart marks the nearest row below.
| Finish | Pace / km | Pace / mile | At 1 mile | At 2 miles | kph | mph |
|---|---|---|---|---|---|---|
| 12:00 to 14:30 | ||||||
| 12:00 | 2:24 | 3:52 | 3:52 | 7:43 | 25.0 | 15.5 |
| 12:30 | 2:30 | 4:01 | 4:01 | 8:03 | 24.0 | 14.9 |
| 13:00 | 2:36 | 4:11 | 4:11 | 8:22 | 23.1 | 14.3 |
| 13:30 | 2:42 | 4:21 | 4:21 | 8:41 | 22.2 | 13.8 |
| 14:00 | 2:48 | 4:30 | 4:30 | 9:01 | 21.4 | 13.3 |
| 14:30 | 2:54 | 4:40 | 4:40 | 9:20 | 20.7 | 12.9 |
| 15:00 to 19:30 | ||||||
| 15:00 | 3:00 | 4:50 | 4:50 | 9:39 | 20.0 | 12.4 |
| 15:30 | 3:06 | 4:59 | 4:59 | 9:59 | 19.4 | 12.0 |
| 16:00 | 3:12 | 5:09 | 5:09 | 10:18 | 18.8 | 11.7 |
| 16:30 | 3:18 | 5:19 | 5:19 | 10:37 | 18.2 | 11.3 |
| 17:00 | 3:24 | 5:28 | 5:28 | 10:57 | 17.6 | 11.0 |
| 17:30 | 3:30 | 5:38 | 5:38 | 11:16 | 17.1 | 10.7 |
| 18:00 | 3:36 | 5:48 | 5:48 | 11:35 | 16.7 | 10.4 |
| 18:30 | 3:42 | 5:57 | 5:57 | 11:55 | 16.2 | 10.1 |
| 19:00 | 3:48 | 6:07 | 6:07 | 12:14 | 15.8 | 9.8 |
| 19:30 | 3:54 | 6:17 | 6:17 | 12:33 | 15.4 | 9.6 |
| 20:00 to 24:30 | ||||||
| 20:00 | 4:00 | 6:26 | 6:26 | 12:52 | 15.0 | 9.3 |
| 20:30 | 4:06 | 6:36 | 6:36 | 13:12 | 14.6 | 9.1 |
| 21:00 | 4:12 | 6:46 | 6:46 | 13:31 | 14.3 | 8.9 |
| 21:30 | 4:18 | 6:55 | 6:55 | 13:50 | 14.0 | 8.7 |
| 22:00 | 4:24 | 7:05 | 7:05 | 14:10 | 13.6 | 8.5 |
| 22:30 | 4:30 | 7:15 | 7:15 | 14:29 | 13.3 | 8.3 |
| 23:00 | 4:36 | 7:24 | 7:24 | 14:48 | 13.0 | 8.1 |
| 23:30 | 4:42 | 7:34 | 7:34 | 15:08 | 12.8 | 7.9 |
| 24:00 | 4:48 | 7:43 | 7:43 | 15:27 | 12.5 | 7.8 |
| 24:30 | 4:54 | 7:53 | 7:53 | 15:46 | 12.2 | 7.6 |
| 25:00 to 29:30 | ||||||
| 25:00 | 5:00 | 8:03 | 8:03 | 16:06 | 12.0 | 7.5 |
| 25:30 | 5:06 | 8:12 | 8:12 | 16:25 | 11.8 | 7.3 |
| 26:00 | 5:12 | 8:22 | 8:22 | 16:44 | 11.5 | 7.2 |
| 26:30 | 5:18 | 8:32 | 8:32 | 17:04 | 11.3 | 7.0 |
| 27:00 | 5:24 | 8:41 | 8:41 | 17:23 | 11.1 | 6.9 |
| 27:30 | 5:30 | 8:51 | 8:51 | 17:42 | 10.9 | 6.8 |
| 28:00 | 5:36 | 9:01 | 9:01 | 18:01 | 10.7 | 6.7 |
| 28:30 | 5:42 | 9:10 | 9:10 | 18:21 | 10.5 | 6.5 |
| 29:00 | 5:48 | 9:20 | 9:20 | 18:40 | 10.3 | 6.4 |
| 29:30 | 5:54 | 9:30 | 9:30 | 18:59 | 10.2 | 6.3 |
| 30:00 to 34:30 | ||||||
| 30:00 | 6:00 | 9:39 | 9:39 | 19:19 | 10.0 | 6.2 |
| 30:30 | 6:06 | 9:49 | 9:49 | 19:38 | 9.8 | 6.1 |
| 31:00 | 6:12 | 9:59 | 9:59 | 19:57 | 9.7 | 6.0 |
| 31:30 | 6:18 | 10:08 | 10:08 | 20:17 | 9.5 | 5.9 |
| 32:00 | 6:24 | 10:18 | 10:18 | 20:36 | 9.4 | 5.8 |
| 32:30 | 6:30 | 10:28 | 10:28 | 20:55 | 9.2 | 5.7 |
| 33:00 | 6:36 | 10:37 | 10:37 | 21:15 | 9.1 | 5.6 |
| 33:30 | 6:42 | 10:47 | 10:47 | 21:34 | 9.0 | 5.6 |
| 34:00 | 6:48 | 10:57 | 10:57 | 21:53 | 8.8 | 5.5 |
| 34:30 | 6:54 | 11:06 | 11:06 | 22:13 | 8.7 | 5.4 |
| 35:00 to 39:30 | ||||||
| 35:00 | 7:00 | 11:16 | 11:16 | 22:32 | 8.6 | 5.3 |
| 35:30 | 7:06 | 11:26 | 11:26 | 22:51 | 8.5 | 5.3 |
| 36:00 | 7:12 | 11:35 | 11:35 | 23:10 | 8.3 | 5.2 |
| 36:30 | 7:18 | 11:45 | 11:45 | 23:30 | 8.2 | 5.1 |
| 37:00 | 7:24 | 11:55 | 11:55 | 23:49 | 8.1 | 5.0 |
| 37:30 | 7:30 | 12:04 | 12:04 | 24:08 | 8.0 | 5.0 |
| 38:00 | 7:36 | 12:14 | 12:14 | 24:28 | 7.9 | 4.9 |
| 38:30 | 7:42 | 12:24 | 12:24 | 24:47 | 7.8 | 4.8 |
| 39:00 | 7:48 | 12:33 | 12:33 | 25:06 | 7.7 | 4.8 |
| 39:30 | 7:54 | 12:43 | 12:43 | 25:26 | 7.6 | 4.7 |
| 40:00 to 44:30 | ||||||
| 40:00 | 8:00 | 12:52 | 12:52 | 25:45 | 7.5 | 4.7 |
| 40:30 | 8:06 | 13:02 | 13:02 | 26:04 | 7.4 | 4.6 |
| 41:00 | 8:12 | 13:12 | 13:12 | 26:24 | 7.3 | 4.5 |
| 41:30 | 8:18 | 13:21 | 13:21 | 26:43 | 7.2 | 4.5 |
| 42:00 | 8:24 | 13:31 | 13:31 | 27:02 | 7.1 | 4.4 |
| 42:30 | 8:30 | 13:41 | 13:41 | 27:22 | 7.1 | 4.4 |
| 43:00 | 8:36 | 13:50 | 13:50 | 27:41 | 7.0 | 4.3 |
| 43:30 | 8:42 | 14:00 | 14:00 | 28:00 | 6.9 | 4.3 |
| 44:00 | 8:48 | 14:10 | 14:10 | 28:19 | 6.8 | 4.2 |
| 44:30 | 8:54 | 14:19 | 14:19 | 28:39 | 6.7 | 4.2 |
| 45:00 to 49:30 | ||||||
| 45:00 | 9:00 | 14:29 | 14:29 | 28:58 | 6.7 | 4.1 |
| 45:30 | 9:06 | 14:39 | 14:39 | 29:17 | 6.6 | 4.1 |
| 46:00 | 9:12 | 14:48 | 14:48 | 29:37 | 6.5 | 4.1 |
| 46:30 | 9:18 | 14:58 | 14:58 | 29:56 | 6.5 | 4.0 |
| 47:00 | 9:24 | 15:08 | 15:08 | 30:15 | 6.4 | 4.0 |
| 47:30 | 9:30 | 15:17 | 15:17 | 30:35 | 6.3 | 3.9 |
| 48:00 | 9:36 | 15:27 | 15:27 | 30:54 | 6.3 | 3.9 |
| 48:30 | 9:42 | 15:37 | 15:37 | 31:13 | 6.2 | 3.8 |
| 49:00 | 9:48 | 15:46 | 15:46 | 31:33 | 6.1 | 3.8 |
| 49:30 | 9:54 | 15:56 | 15:56 | 31:52 | 6.1 | 3.8 |
| 50:00 to 54:30 | ||||||
| 50:00 | 10:00 | 16:06 | 16:06 | 32:11 | 6.0 | 3.7 |
| 50:30 | 10:06 | 16:15 | 16:15 | 32:31 | 5.9 | 3.7 |
| 51:00 | 10:12 | 16:25 | 16:25 | 32:50 | 5.9 | 3.7 |
| 51:30 | 10:18 | 16:35 | 16:35 | 33:09 | 5.8 | 3.6 |
| 52:00 | 10:24 | 16:44 | 16:44 | 33:28 | 5.8 | 3.6 |
| 52:30 | 10:30 | 16:54 | 16:54 | 33:48 | 5.7 | 3.6 |
| 53:00 | 10:36 | 17:04 | 17:04 | 34:07 | 5.7 | 3.5 |
| 53:30 | 10:42 | 17:13 | 17:13 | 34:26 | 5.6 | 3.5 |
| 54:00 | 10:48 | 17:23 | 17:23 | 34:46 | 5.6 | 3.5 |
| 54:30 | 10:54 | 17:33 | 17:33 | 35:05 | 5.5 | 3.4 |
| 55:00 to 1:00:00 | ||||||
| 55:00 | 11:00 | 17:42 | 17:42 | 35:24 | 5.5 | 3.4 |
| 55:30 | 11:06 | 17:52 | 17:52 | 35:44 | 5.4 | 3.4 |
| 56:00 | 11:12 | 18:01 | 18:01 | 36:03 | 5.4 | 3.3 |
| 56:30 | 11:18 | 18:11 | 18:11 | 36:22 | 5.3 | 3.3 |
| 57:00 | 11:24 | 18:21 | 18:21 | 36:42 | 5.3 | 3.3 |
| 57:30 | 11:30 | 18:30 | 18:30 | 37:01 | 5.2 | 3.2 |
| 58:00 | 11:36 | 18:40 | 18:40 | 37:20 | 5.2 | 3.2 |
| 58:30 | 11:42 | 18:50 | 18:50 | 37:40 | 5.1 | 3.2 |
| 59:00 | 11:48 | 18:59 | 18:59 | 37:59 | 5.1 | 3.2 |
| 59:30 | 11:54 | 19:09 | 19:09 | 38:18 | 5.0 | 3.1 |
| 1:00:00 | 12:00 | 19:19 | 19:19 | 38:37 | 5.0 | 3.1 |
| 5K | Metric | Imperial |
|---|---|---|
| Exact distance | 5 km | 3.1069 mi |
| 20:00 finish | 4:00 /km | 6:26 /mi |
| 25:00 finish | 5:00 /km | 8:03 /mi |
| 30:00 finish | 6:00 /km | 9:39 /mi |
What is a 5K pace chart?
A 5K pace chart translates every finish time over 5 kilometres into the pace you need per kilometre and per mile. Because 5 km divides neatly, round times give round paces: 20:00 is 4:00 per km, 25:00 is 5:00 per km. The rows in between run 30 seconds apart.
How to read the 5K chart
Find the finish time you want in the left column and read across. The chart runs from 12:00 to 60:00 in 30-second steps, 97 rows in 5-minute blocks with jump links above the table. At the fast end 12:00 needs 2:24 per km; at the slow end 1:00:00 is 12:00 per km or 5.0 kph, so walkers have a row as well. Moving one row up the chart takes 6 seconds off every kilometre. The 20:00, 25:00 and 30:00 rows are marked as round targets.
A 20:00 5K needs 4:00 min/km, which is 6:26 min/mile and a treadmill speed of 15.0 kph. Slow that to 25:00 and the pace eases to 5:00 min/km, or 8:03 min/mile at 12.0 kph. The two split columns give the elapsed time at 1 mile and 2 miles, which suits a track, a course with mile markers or a watch set to beep every mile: for 25:00 they read 8:03 and 16:06, and the last 1.781 km after the 2 mile mark is all that is left to spend whatever you saved.
Pacing a weekly timed 5K
Free weekly timed 5K events, held on the same park course week after week, make the 5K a race you can repeat as often as you like, and that turns this chart into a progress tracker as much as a goal setter. Because the course stays the same, a change in your time mostly reflects a change in you rather than in the route, weather aside. Improving by one row, 30 seconds over the full distance, means finding 6 seconds on every kilometre.
A few practical points apply to that format. Park courses can include laps, turns and narrow paths, and some have few or no distance markers, so the 1 mile split column is the most dependable checkpoint: when your watch beeps the first mile on a 25:00 attempt it should read close to 8:03. The official time runs from the start signal to the finish line, so a watch started late will flatter you. Set your target from recent results on the same course rather than from a flat road race, and look up any time in between with the finder.
Find any 5K time and share it
The finder above accepts any time, including ones between rows such as 23:15 or 27:45. It returns the exact pace, the speed in both units and the mile splits, marks the nearest row in the chart and writes the time into the page address, so this link for a 23:15 5K opens on the same answer for anyone you send it to. Plan splits and a pace band passes the time to the splits calculator, and the buttons under the chart copy the table, download it as CSV or print it.
Training toward a 5K goal
The 5K rewards a blend of speed and stamina, which makes goal pace feel genuinely hard from early on. A common approach is to run repeats at target pace, for example five or six times 1 km at your goal per-kilometre time with short recoveries, so the pace becomes familiar before race day. Once you can hold it comfortably in training, the finish time on the chart becomes reachable. To model a specific target more precisely, drop your numbers into the pace calculator.
From 5K to longer races
A fresh 5K time is also a useful predictor of what you can run at longer distances. Feed it into the race time predictor: with Riegel's formula a 25:00 5K points to a 52:07 10K (5:13 per km) and a 1:55:00 half marathon. Compare that against the 10K pace chart. Because effort does not scale linearly, your longer-race pace will be slower than your 5K pace, and the predictor accounts for that fade automatically.
Printable 5K pace chart
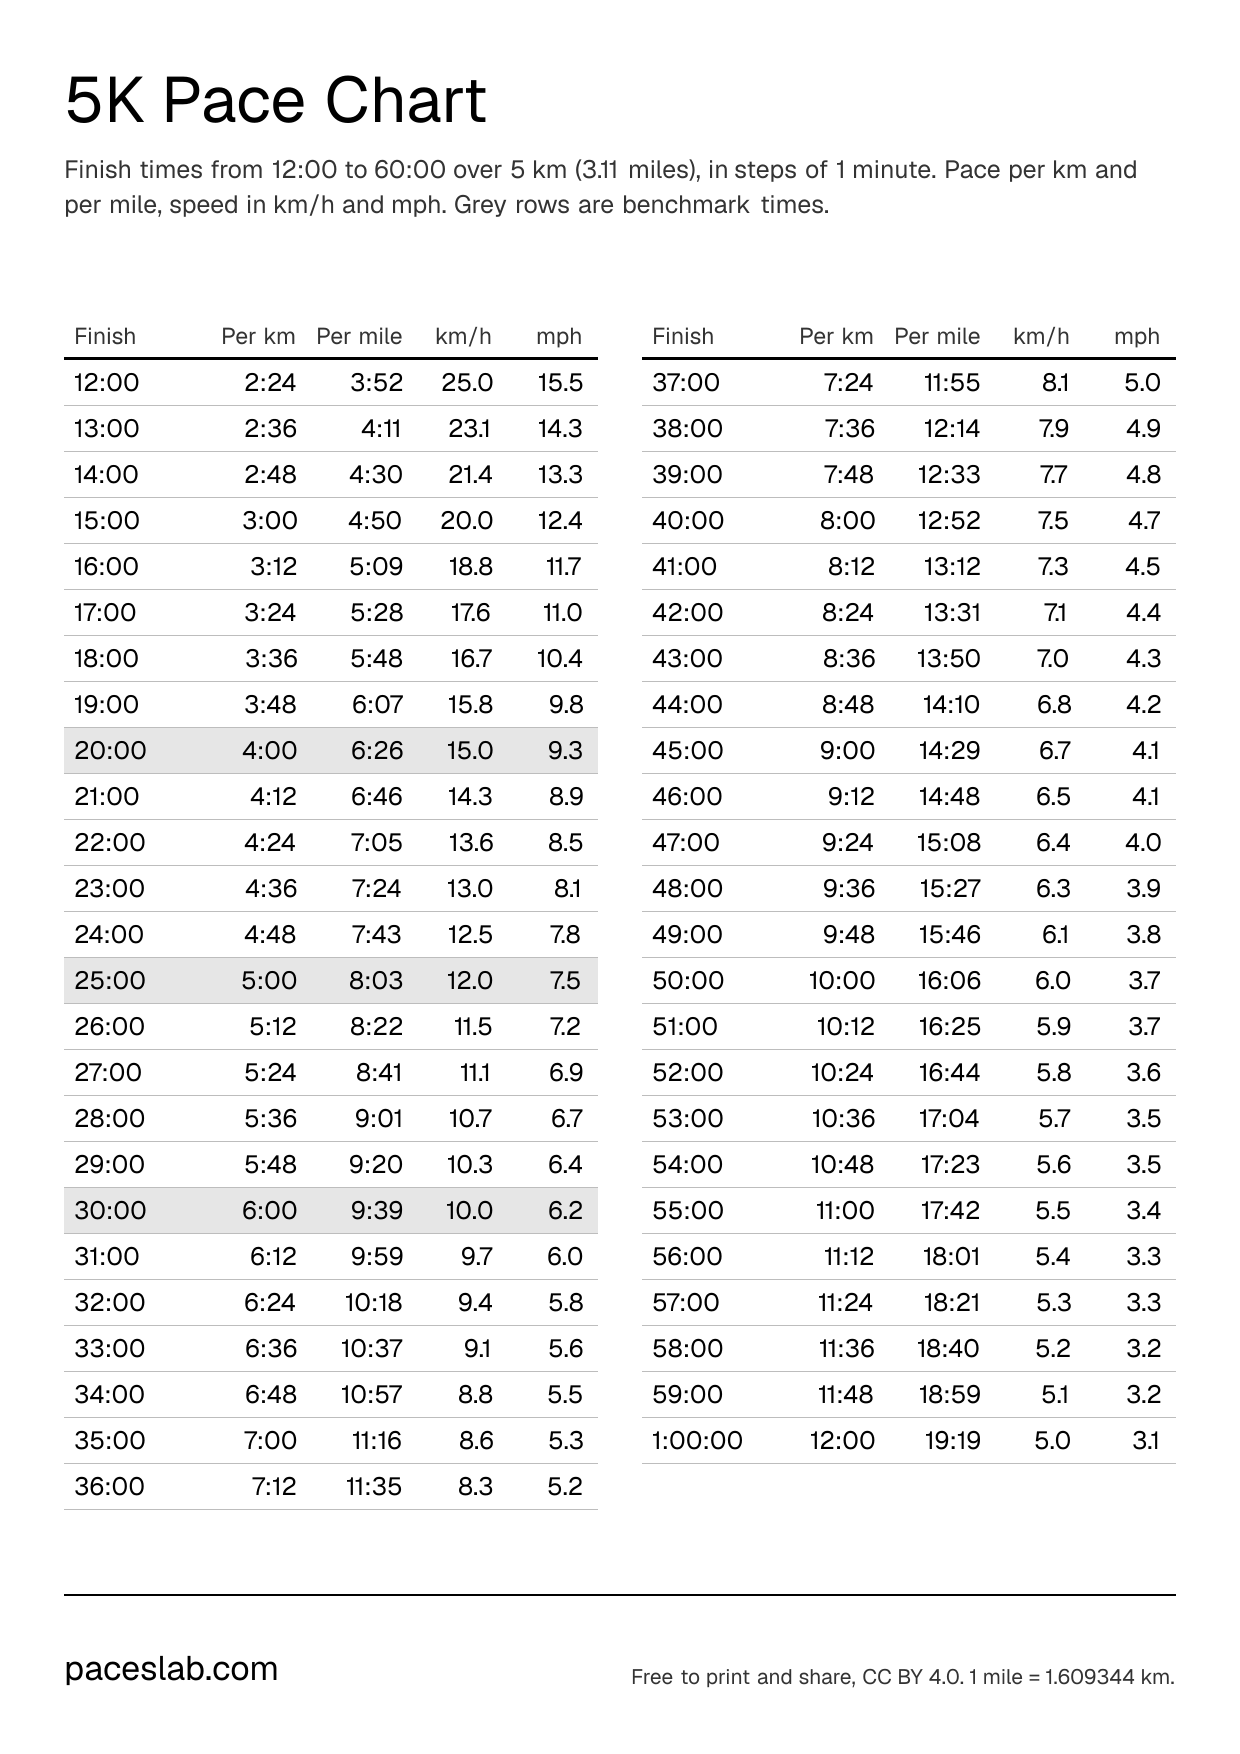
Prefer paper? The image below holds the 5K chart from 12:00 to 60:00 on one A4 sheet, handy to pin up next to a training log. Reuse it with a credit, under the same licence as the PaceLab dataset.
Frequently asked questions
What pace do I need for a 20-minute 5K?
A 20:00 5K is exactly 4:00 min/km, which is 6:26 min/mile and 15.0 kph on a treadmill. At even pace your watch should show 6:26 at the first mile and 12:52 at two miles.
What pace is a 25-minute 5K?
A 25:00 5K is 5:00 min/km, or 8:03 min/mile, an average of 12.0 kph (7.5 mph). Even splits put you through one mile in 8:03 and two miles in 16:06.
What pace is a 30-minute 5K?
A 30:00 5K needs 6:00 min/km, which is 9:39 min/mile or 10.0 kph. It is the slowest of the three marked rows in the chart.
Does the 5K chart cover walking times?
Yes. The chart runs down to 1:00:00, which is 12:00 per km, 19:19 per mile or 5.0 kph (3.1 mph), so a walked or run-walk 5K has its own row too. For anything slower, type the time into the finder: it still gives the exact pace.
How should I pace a weekly timed 5K in the park?
Pick a target from your recent results on the same course, then use the 1 mile column as your first checkpoint, because a park course may have few or no distance markers. Running the first mile a few seconds slower than the chart says usually costs less than running it too fast.
How is the 5K pace chart calculated?
Each pace is the finish time divided by 5 km. Per-mile pace applies the exact factor of 1.609344 km per mile, speed is 3600 divided by the pace in seconds, and the rows run 30 seconds apart from 12:00 to 1:00:00.
More running calculators
Last reviewed . Formulas, constants and sources: methodology. Changes to any calculation are logged in the changelog.
Checked against: marathon 42.195 km (World Athletics), 1 mile = 1.609344 km.